Visualizing the Windows Event Log using ANKHOR
In this blog I will demonstrate the use of the windows event log Plugin for ANKHOR with three simple visualizations. The Plugin is installed from the "Windows Event Log Parser" Package using the Package Manager from the ribbon bar. It comes with an interface library “PluginWindowsEventLog.flsx” which has two major exported operators.
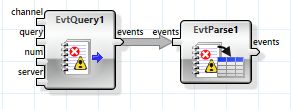
The EvtQuery operator (Query Windows Event Log) reads the given number of event log entries (starting with the most recent) from the given channel. The “query” input can be used to filter the request by providing an XPath. ANKHOR Plugins are implemented using socket communication, so one can simply specify a remote server to query the event log from a second machine (provided that firewall settings etc. are set accordingly).
The result of the EvtQuery operator is a list of XML snippets, each representing one event. The EvtParse operator (Parse Windows Event Log Data to Table) is then used to flatten this into a table, where each row represents one event.

Showing Events over Time
The first visualization is a simple diagram showing the number of events over time, using different colors for the four levels. I am using the DataCube and DashboardCharts library for processing and display.
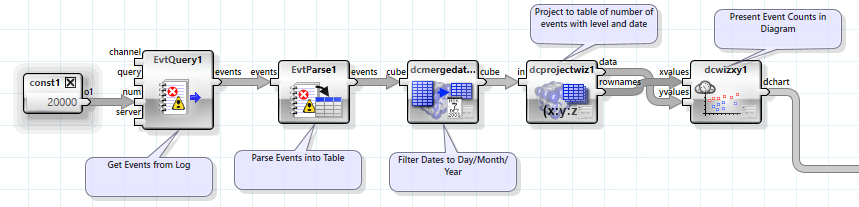
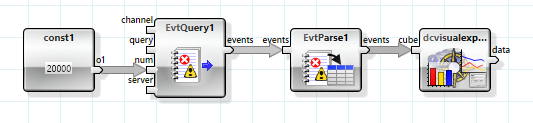
The processing pipeline is simple and linear. The first three operators are used to get and parse the event log entries (up to 20,000 in this case). The next operator reduces the date entry to full days, dropping hours, minutes and seconds to get a more meaningful count.
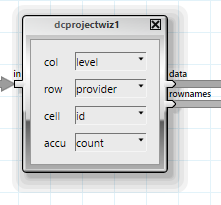
The project operator projects this fact table into a table with the event level as column, the event date as row and the number of events in the cells. The table is split into a list of the dates and a table with the counts, to make it clear, which one is the index and which the data element. This table pair is then provided to the dashboard chart wizard for XY diagrams.
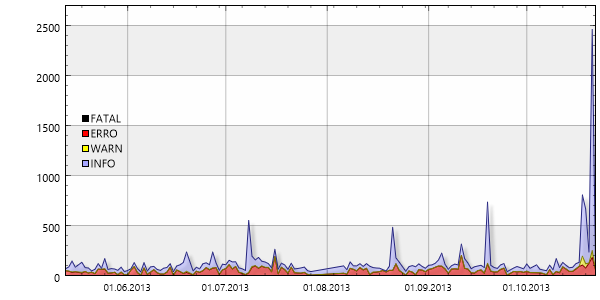
One can see a significant increase in warnings and info message for the last days, which is most likely due to an upgrade to Windows 8.1.
Showing Events by Application
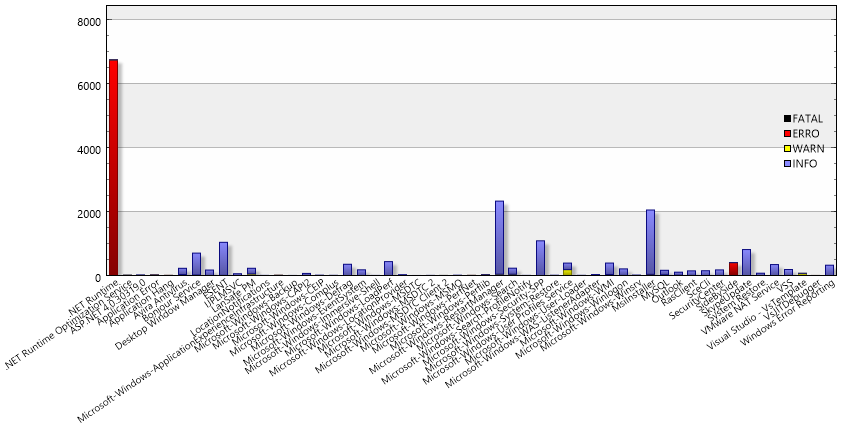
The next chart shall display the event logs based on the provider (in this case the application).
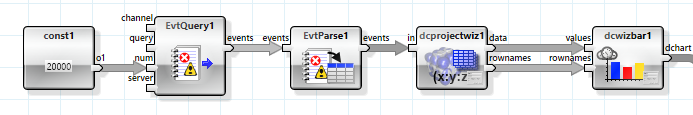
The operator graph is again very simple, the major difference is the project wizard, which will now project by provider and not by date.
Unfortunately the chart is quite full and barely usable:
We will thus need some filtering. We insert a macro into the “data” and “rownames” path to separate the filtering code from the rest of the graph.
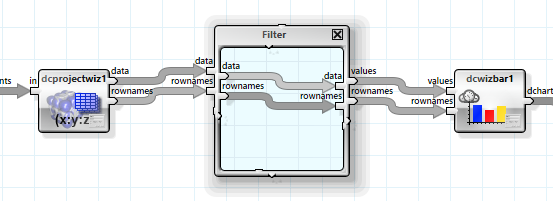
The filtering consists of two steps, first sort the table by decreasing number of events, and second limit it to the first 20 rows.

The chart is now limited to the 20 top event providers.
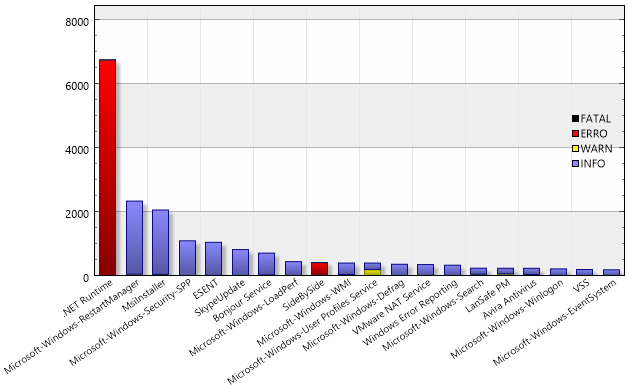
The worst error source in my system appears to be the .NET Runtime – and a closer look into log using the visual data cube explore wizard reveals the source.
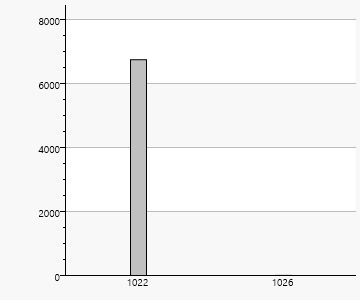
The main reason for errors in my application event log is clearly Event ID 1022 which is related to startup problems of the .NET profiler.
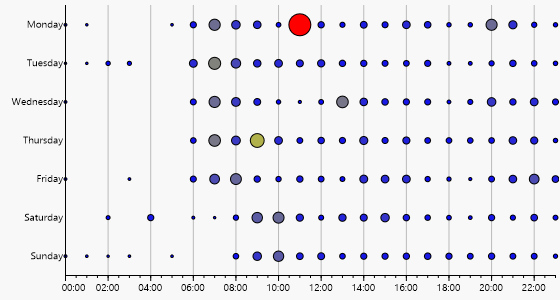
Event Frequency per Day / Hour
The next visualization shows event frequency by weekday and time. This one is generated using the data cube visual explore wizard.
Here we have much less operators, so all magic is hidden in the visual explore wizard.
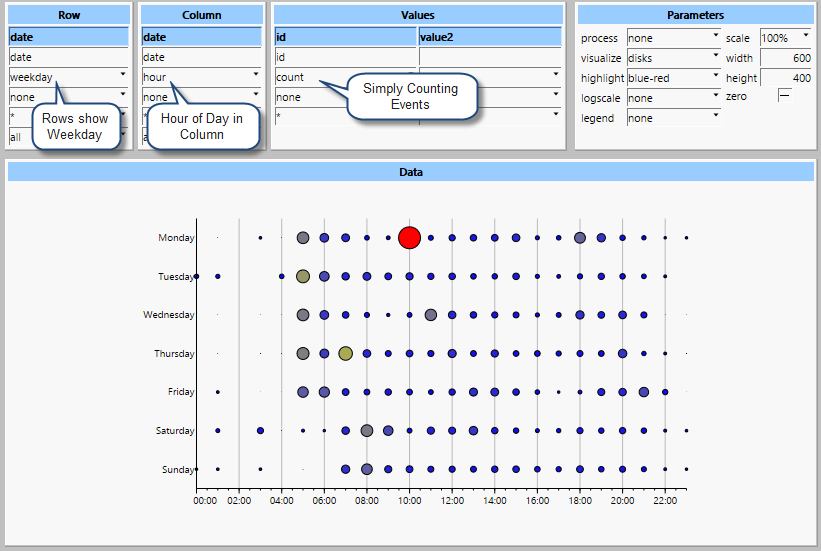
What appears strange is that my morning does not start at 5am but rather 7 to 8am. This is most likely caused by a time zone issue. All events are recorded with GMT, but I live in CET (or sometimes CET + daylight saving). So we should adapt the time here from GMT to local. This is done with an operator from DateTime.
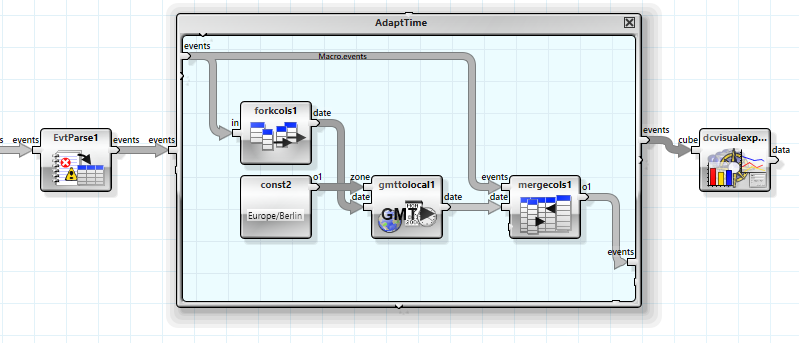
First I split of the date column then I correct it using the gmttolocal operator and finally merge it back into the table. The resulting chart looks much more believable.
Using Interactive Log Filtering
A different approach would be to use the ANKHOR interactive log filter operator, but I will cover this one in a separate blog post.
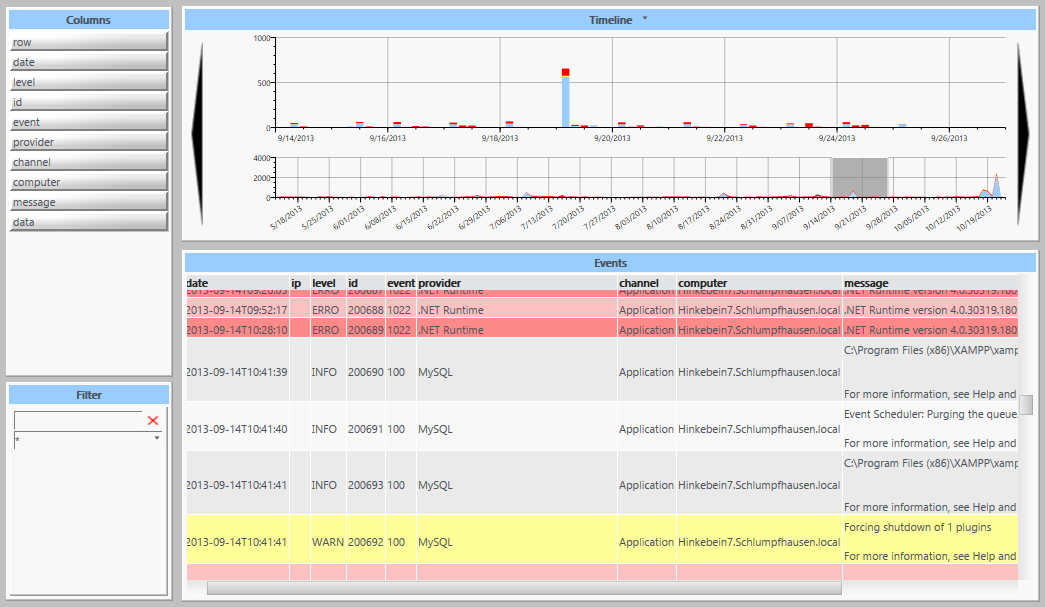
The attached video shows yet another way to watch the event logs, filter by date and dig into various events.
Download FlowSheet samples (ZIP archive)