How To Create A Logfile Viewer in 15 minutes
Last week I had to use a customers tool which starts RTSP sessions in a video on demand network. This tool dumped its logging information into a text file which I had to analyze after each run. The logfile got bigger and bigger and it became more and more inconvinient to find the interessting places. And if that wasn't enough, the log contained a lot of unuseful message lines ( at least for my job ).
To get an idea about the amount of data : the tool produced ~ 500 lines per second.
So I decided to create a little FlowSheet which should support me a little bit.
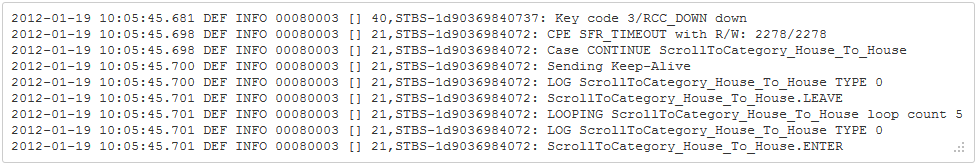
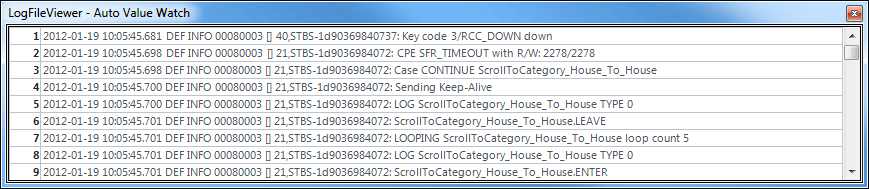
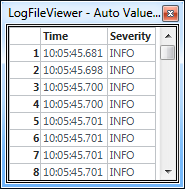
To get you an idea how the original data looks like, here's a little exceprt :
The goals were clear :
- It should not display all messages lines, only the newly added ones
- I'd like to control the update in the viewer
- Specific messages should be filtered out completely
- I didn't want to see all parts of the single message, only time, severity, text and the stb part.
- Specific messages should appear color-coded.
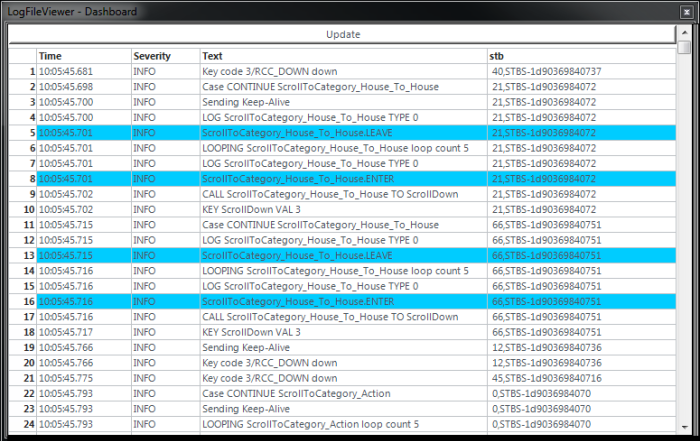
Here's the result :
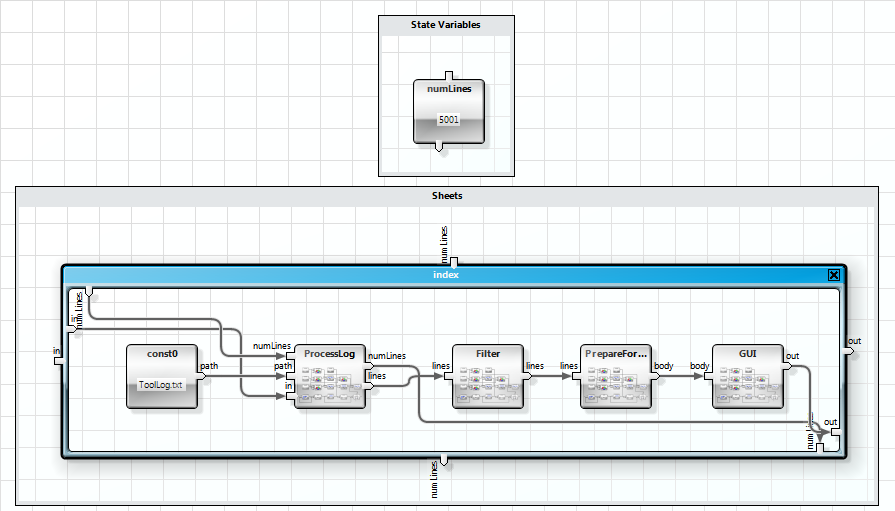
As you can see, I have split the whole thing into several macros.
ProcessLog
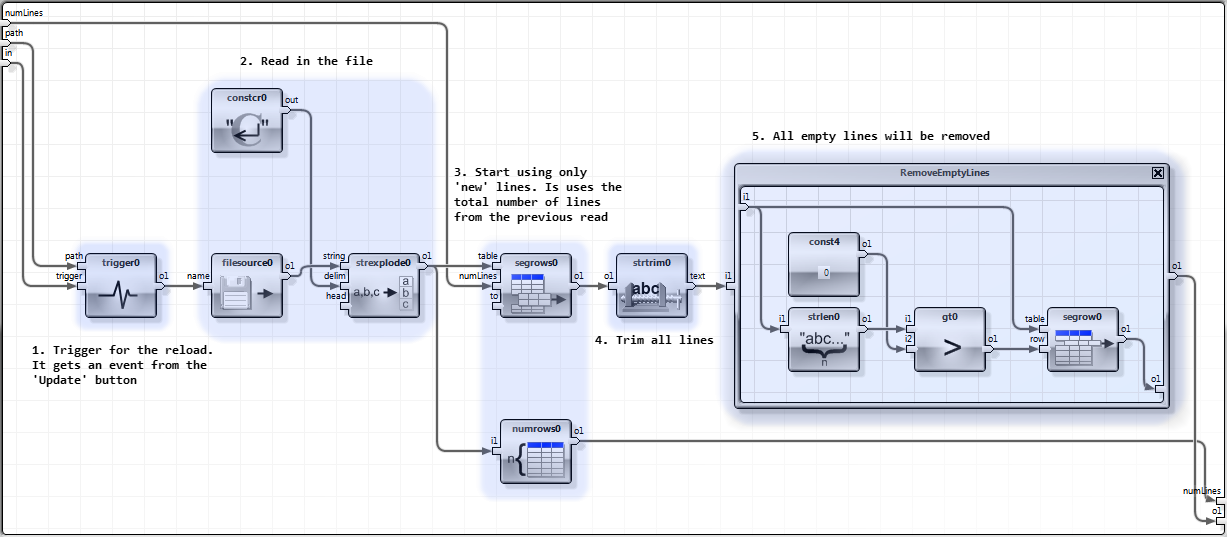
Remember my first design goal ? I want to see only new message lines.
My 'problem' is that the operator 'filesource0' loads the complete file, so I need to cut the resulting table into 2 pieces. Section 3 shows how to do that. The 'segrows0' operator gets the complete table and a value into the 'numLines' input. This value comes from a state variable which will be updated after each load with the total number of message lines. Section 4 removes all leading and trailing white space characters (spaces, tabs, CR and LF characters) from all lines. And last but not least, all emtpy lines will be removed in the macro 'RemoveEmptyLines'.
Result
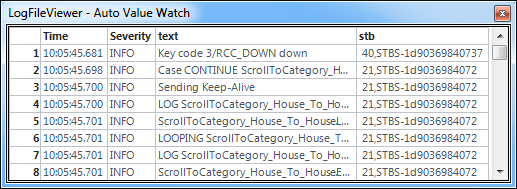
This is the resulting table from macro 'ProcessLog' in the 'Auto Value Watch'.
The raw text was transformed in a simple table ( vector ) without a header.
The table now contains 5001 rows.
Filter
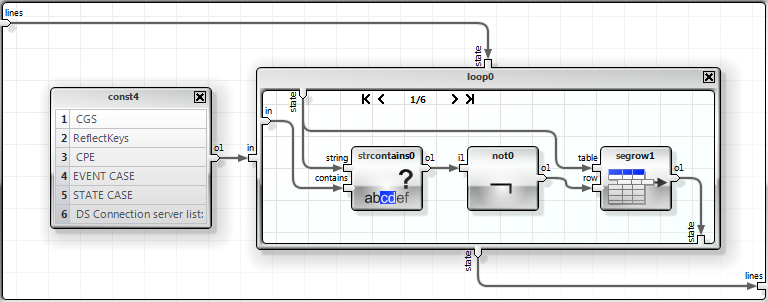
Implementation of my third design goal. It throws out all lines which contains a specific keyword.
The actual filter work is done in the loop.
The loop will be repeated 6 times, one time for every row in the feeding table. The table with the lines is routed in a state input - it gets reused and will be reduced ( hopefully ) in every iteration of the loop.
Result
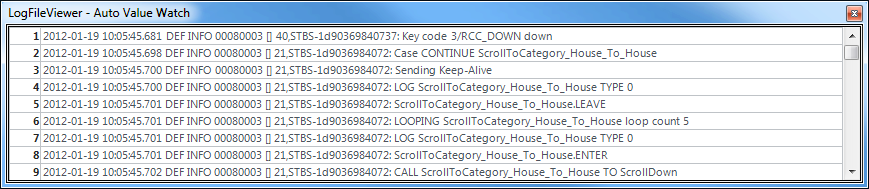
This is the resulting table from macro 'Filter' in the 'Auto Value Watch'.
The table now contains 2461 rows.
PrepareForOutput
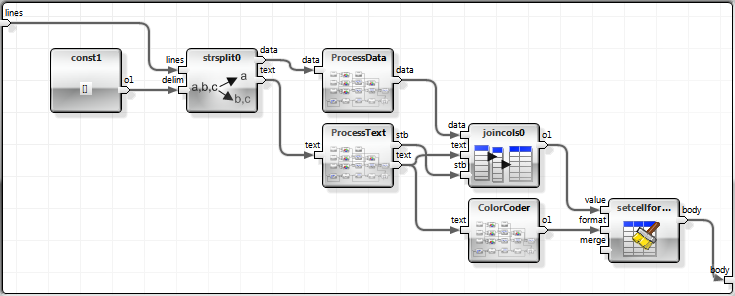
We're getting close. We have reduced the number of lines, but the format of the lines is still the same. As I stated before, I want to see only columns containing time, severity, text and the stb info.
Let's check what happens here. The operator 'strsplit0' chops the incomings lines into 2 pieces. It uses '[]' as the delimiter.
2012-01-19 10:05:45.681 DEF INFO 00080003 [] 40,STBS-1d90369840737: Key code 3/RCC_DOWN down
The outbound connector 'data' delivers
2012-01-19 10:05:45.681 DEF INFO 00080003
to the next macro 'ProcessData'.
ProcessData
ProcessData takes advantage of the powerful 'csvimport' to convert the string into the first piece of our desired destination table.
ProcessText
ProcessText splits the incoming text again into two parts. The operator 'joincols0' creates the destination table for us. It takes the table from 'ProcessData' and adds two new columns to it. The names of the inbound connectors will be used to set the the columns titles. Here's the the result :
Hmm, what's missing ? You're right. The color coding of specifc rows will be applied in the macro 'ColorCoder'.
Result
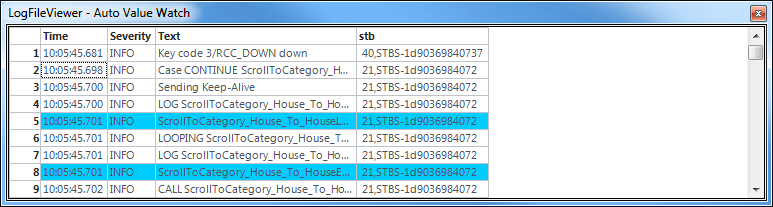
This is the resulting table from macro 'PrepareForOutput' in the 'Auto Value Watch'.
The table is fully formated, is has headers and the color coding was also applied.
GUI
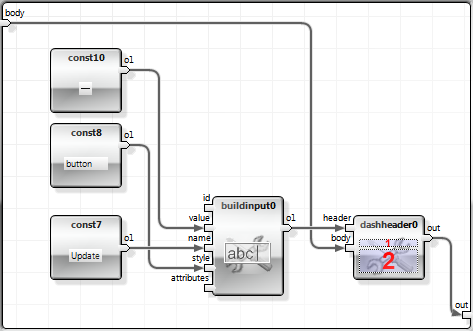
One thing is still missing. I'd like to have a button on my dashboard to initiate the update process. This is an easy task. I use 'buildinput0' which creates the desired button for me. The final step is used to glue the properly formatted table together with my button and pass the result to the dashboard.
Done
Looking behind I would say creating the FlowSheet hasn't saved me any time.It took me 10 times longer to write this article :) Download FlowSheet and Sample (ZIP archive)